New Rainbow GUI
We have developed a new Rainbow GUI that is more than a set of log windows. The aim of this GUI is to:
- provide information about the connectedness between certain components in Rainbow (e.g., which probes are sending information to which gauges).
- display information about how each component was configured in Rainbow.
- show dynamically what is happening in Rainbow as adaptations are occuring
The GUI is also customizable to different instantiations of Rainbow.
Note that this GUI is in beta (even more than Rainbow). It is used in the Simple Example that is provided.
Main Rainbow Window
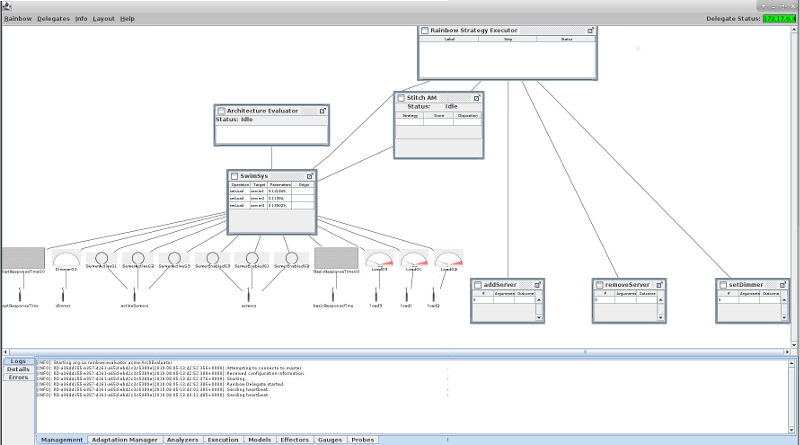
The Rainbow Window is divided into three main parts:
- The menu bar and status. The status of each Rainbow delegate (i.e., Rainbow agent running on any machine, including the local) is displayed to the right.
- The Rainbow canvas depicts the connection diagram of all Rainbow components. Probes and effectors are shown at the bottom of this window (because they interact directly with the system). Gauges are shown above probes. The model(s), analyzer(s), adaptation manager(s), an executor(s) are then laid out showing how they are connected.
- The selection pane, which displays information about Rainbow and also the selected
elements in the Rainbow window. The selection window has three tabs:
- The Logs tab displays the consolidated logs of each kind of component in Rainbow (similar to the old Rainbow GUI).
- The Details tab displays details associated with the the selected element in the Rainbow window.
- The Errors tab displays any errors that Rainbow has produced.
Probe UI
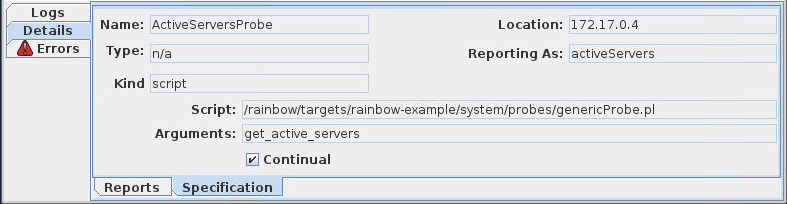
Probes are represented by the  icon. When selecting a
probe, the focus of the selection pane will display its details in the Details tab.
This tab has two parts:
icon. When selecting a
probe, the focus of the selection pane will display its details in the Details tab.
This tab has two parts:
- Reports: Displays the probe reports that the probe has given so far. These are usually the string that the probe writes on the Probe Bus that is consumed by a gauge.
- Sepcification: Displays the specification details of the probe, as specified in the probes.yml file of the target. This displays the name, location, how it is referred to by a gauge, and what is executed by this probe (in the example, it is a script).
Gauge UI
Gauges take probe reports as input and produce operations to update a model as output. In the Rainbow window, the probes that are reporting to gauges and the model that a gauge updates are connected to the gauge. Gauges can have four different visual depictions in the window, and are specified in the UI specification file (see UI Customization section).
| Icon | Meaning | Type in specification |
|---|---|---|
 |
Default Image | No specification |
 |
Meter | dial |
 |
Time Series | timeseries - shows the values over time |
 |
Binary | onoff - Shows a value that toggles between true and false |
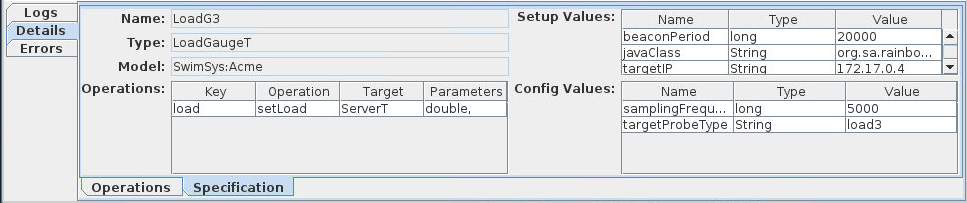
When selecting a gauge, the Details tab contains two parts:
- Operations, which displays the operations that the gauge as emitted to change the model it is connected to.
- Specification, which displays how the gauge was specified, including the operations it is allowed to emit, the Java class implementing the gauge, how it was configured, and how it was set up.
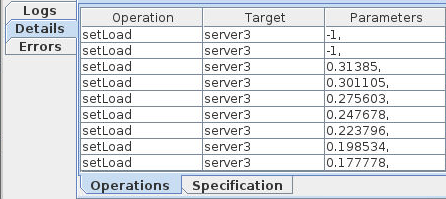
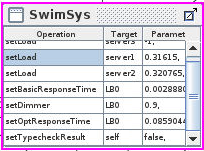
Model UI
Each model in the Rainbow window shows the operations and target table that gives the most recent operation that was given for that operation and target.
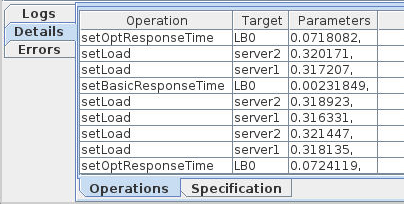
When selecting the model, the Operations tab shows the list of operations (ordered by most recent) that have been executed by the model.
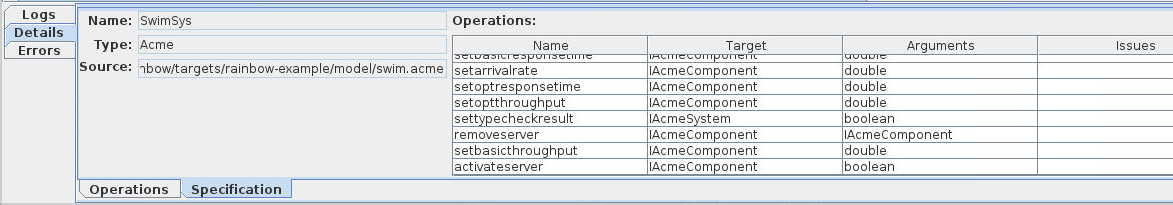
The Specification tab shows the source for the model, as well as the valid operations on that model.
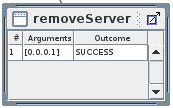
Effector UI
Effectors perform actions on the system in response to operations published by executors. The entry on the Rainbow window for an effector is a table of the number of times it has been executed, the parameters passed to it, and whether it completed successfully or not.
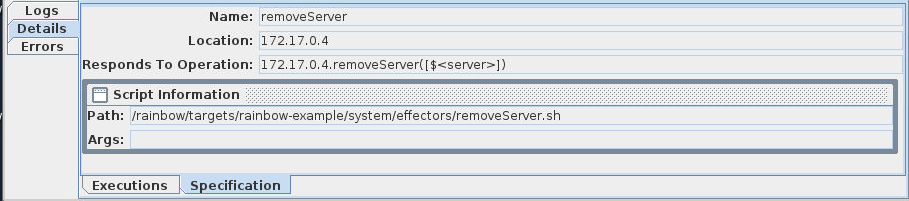
In the selection pane, the specification for the effector is displayed. It shows the
name of the effector, the operation it executes in response to, and what the effector
executes (e.g., a script on some machine).
For the next three types of components, the user interface needs to be customized for the specific component. In the following sections we assume that Rainbow is being used in the classic case, where the analyzer is doing architectural analysis, and the architecture manager and executor use the DSL Stitch
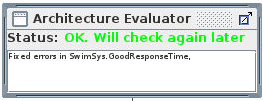
Analysis UI
The analysis UI shows output from the architectural analysis of a model. The status shows the current state of the architectural analysis. Underneath, if there are errors, an indication of the error is displayed there.
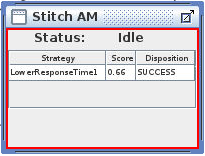
Adaptation Manager UI
The adaptation manager chooses which strategy to execute in response to an error. The element in the Rainbow window lists the history of the strategies that have been chosen by Rainbow, what the final utility is predicted to be, and, once executed, whether the strategy was successful or not.
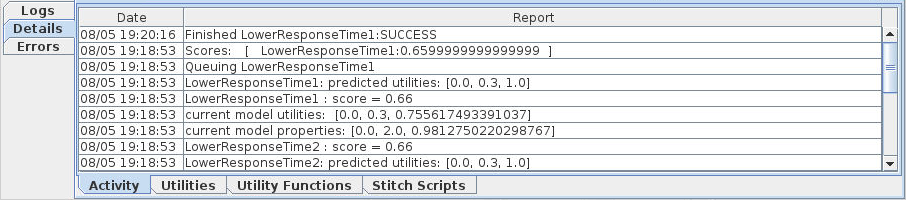
The Selection pane for the adaptation manager shows four tabs.
- Activity currently shoes the log messages that the planner produces.
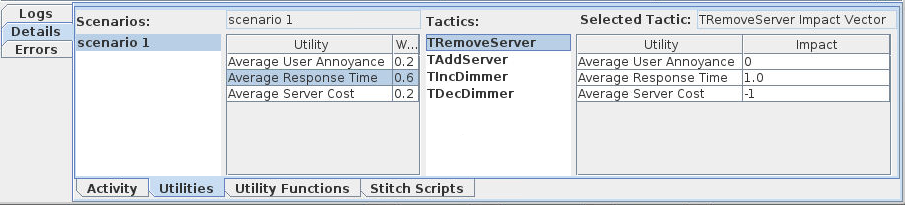
- Utilities shows the utility preferences and scenarios that are defined within rainbow,
and the impact vectors for each of the tactics.
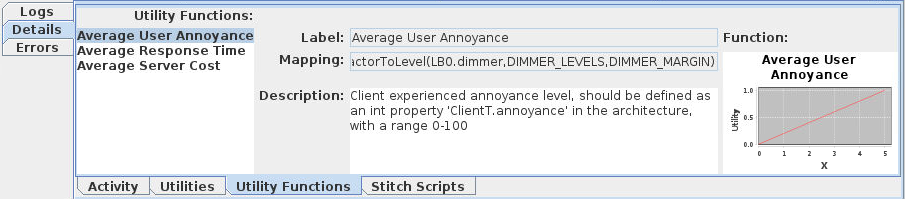
- Functions shows the utility functions, that map values for a quality to a preference
value between [0,1].
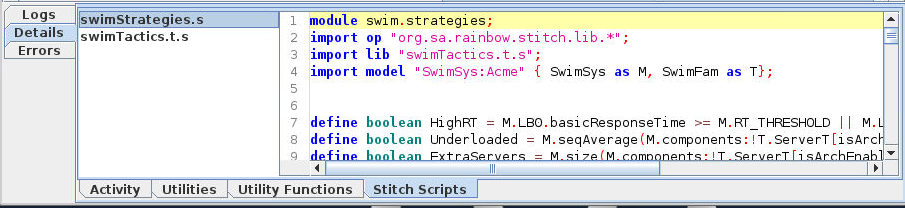
- Stitch Scripts displays the Stitch Scripts that Rainbow knows about.
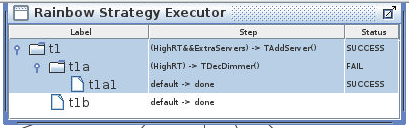
Executor UI
The executor managers the execution of the strategy. In the Rainbow window, the most recently executed strategy is displayed in a tree. The branches that were executed are highlighted in blue and the result of each node is displayed in the far right.
UI Customization
The UI can be customized in a number of ways, in keeping with the customization of Rainbow
more generally. To use the GUI in a rainbow instantation, you should specify the following
in the relvant rainbow.properties file for the target:
rainbow.gui = org.sa.rainbow.gui.RainbowWindoe
In addition you can specify the UI customization file:
rainbow.gui.specs = ui.yml
Gauge UI customization
Gauges can be shown in a number of builtin ways on the Rainbow canvas. This is specified
in the gauges section of the customization file. For each gauge type you want to customize,
you can specify the way it should be presented on the canvas in the following way:
gauges:
  <GAUGE_TYPE>: # The type of the gauge as defined in gauges.yml
    builtin:
      category: meter | timeseries | onoff # The kind customization
      command: <COMMAND> # A command specified like in the gauges.yml
                         # This command will specify the value origin
                         # e.g., ServerT.setLoad(<$load>)
      value: <VALUE>     # which part of the command is used as the
                         # value to display, e.g., $<load> above
      upper: <NUMBER>    # The upper limit of the depicition
      lower: <NUMBER>    # The lower bound of the depiction
      threshold: <NUMBER> # The threshold to display
     # Note that the last three are not relevant for onoff category
Other elements
Other elements on the canvas can be customized to use a particular class for a particular
component. Valid kinds of elements are analyzers, managers, executors. For example,
to customize how a Stitch-based adaptation manager should be displayed, the following
would be specified in the YAML file:
managers:
  org.sa.rainbow.stitch.adaptation.AdaptationManager: org.sa.rainbow.stitch.gui.manager.ArchStitchAdapationManager
This means that if an Adaptation Manager instantiates org.sa.rainbow.stitch.adaptation.AdaptationManager
then the GUI will instantiate the class org.sa.riainbow.stitch.gui.manager.ArchStitchAdaptationManger.
Each of these classes should extend a JPanel, and may implement IUIReporter.
Details
In addition to customizing how elements are displayed on the canvas, how their details are presented in the Detals pane can also be specified. For example, to change the way adaptation manager details are shown:
details:
  managers: org.sa.rainbow.stitch.gui.manager.StitchAdaptationManagerTabbedPane
This should extend the class org.sa.rainbow.gui.arch.elements.AdaptationManagerTabbedPane